Process
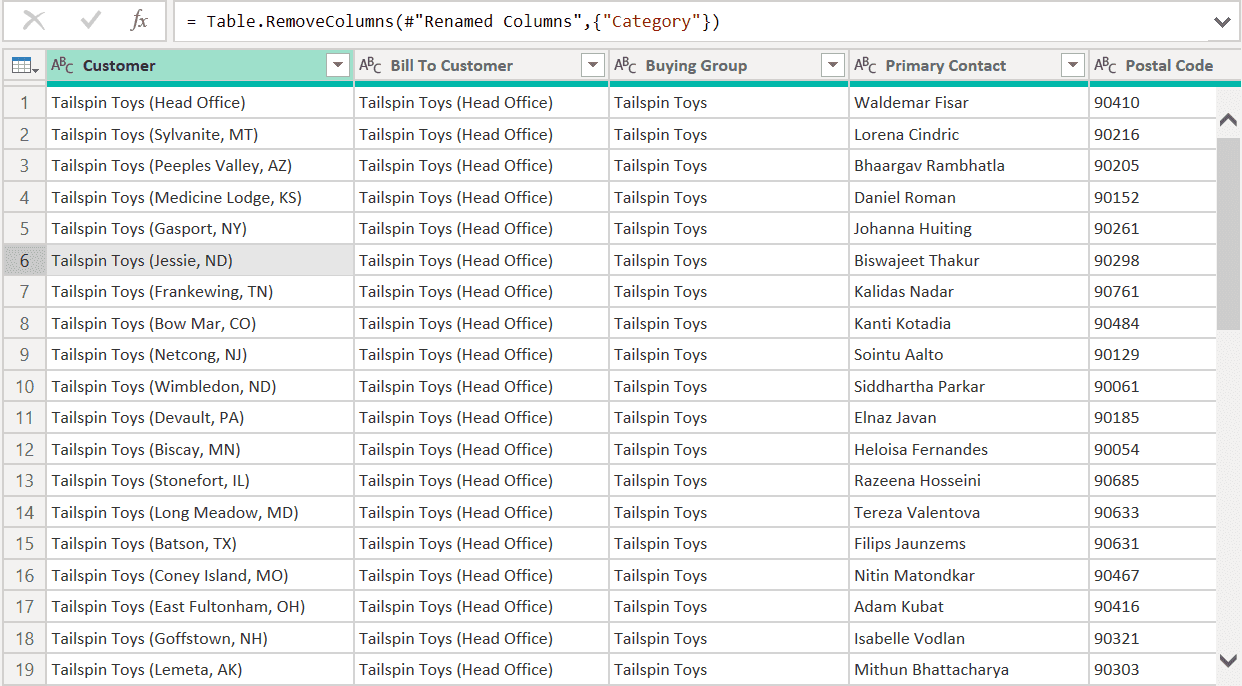
Data Transformation & Cleaning
Creating Data Models & Relationships
Data Visualization & Dashboard Creation
Implementation
I explored the data (business records) to identify trends, enhance efficiency, and improve the customer experience, thereby bridging the gap between raw data (business records) and actionable insights. My focus was on business performance and using data (business records) to drive strategic decisions.
Outcome
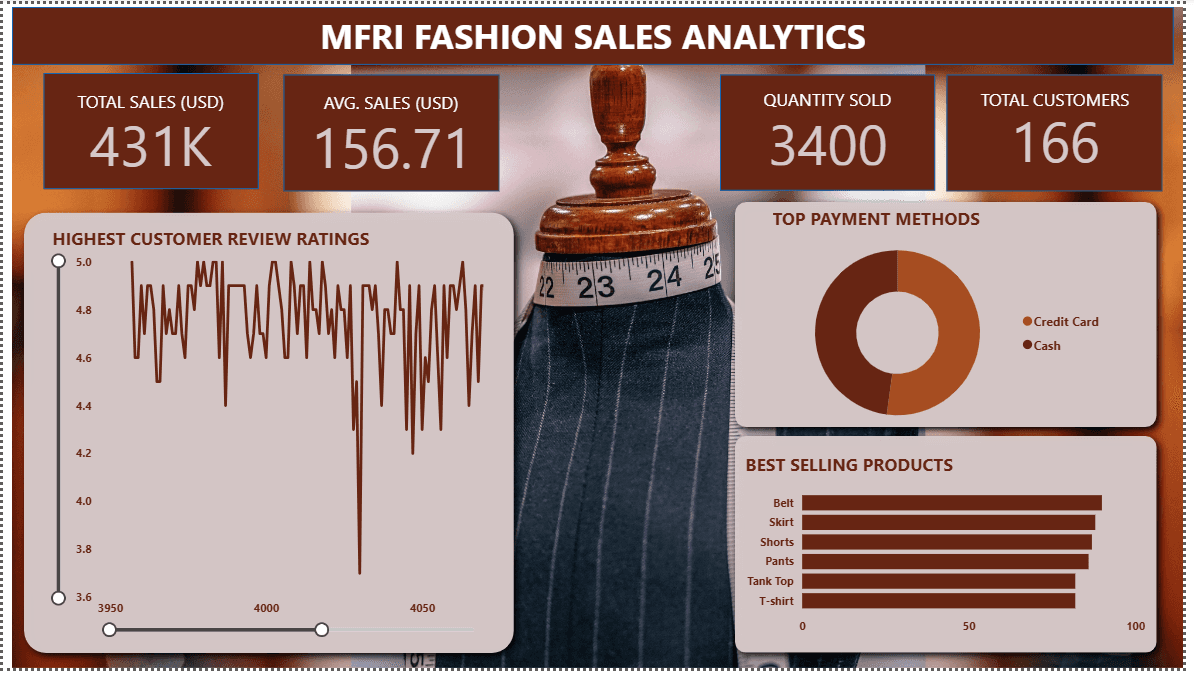
Sales Analytics Dashboard: This is the general overview and visual representation of the business growth.
Customer Review Rating Visualizations: This helped the business identify the exact number of customers who gave low ratings, and the customer experience team were able to reach out to them using the records to get their feedback on why they gave the business very low ratings, and to also earn their trust and loyalty.
Product Performance Analysis: This helped the business know the best-selling and least-selling products, which helped them make the decisions to create bundle offers to encourage their customers to purchase the least-selling products quickly. It also helped them focus on restocking more of their best-sellers.
Payment Method Analysis: This was useful to identify how their customers prefer to make payment for their orders.